Free conversion audit to identify and fix the leaks in your funnel. Get a prescriptive roadmap showing exactly where you're losing revenue and how to fix it.
Diagnose Your Conversion Gap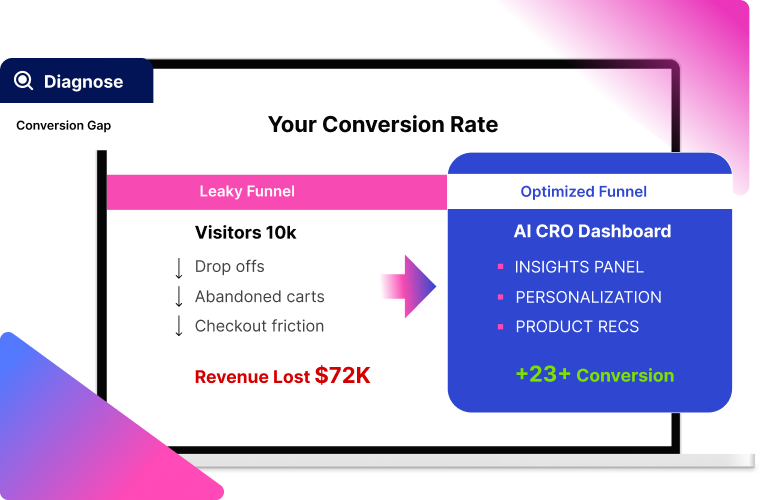
Your conversion rate is flat. Or worse, it's declining. Traffic is up, but revenue isn't growing proportionally. You've been watching this for quarters, and it's not getting better on its own.
You know competitors in your category are converting better. The board is asking why conversion isn't improving. The CFO is questioning marketing spend. Your team knows there's a problem but can't pinpoint the fix.
This isn't a theoretical problem. It's real money leaving the table every day.
Every quarter you wait, recovery gets harder. Conversion gaps compound. Customers form habits with competitors. Your team's confidence erodes.
At your traffic volume, every 1% conversion improvement equals significant annual revenue. If you're driving 100,000 visitors per month at a $100 AOV and converting at 2%, that's $200,000 in monthly revenue. Move to 3% and you're at $300,000—$1.2M additional annual revenue. Every month you don't fix conversion, you're missing that.
You're paying more to acquire traffic that isn't converting. Your cost per acquisition goes up while conversion stays flat. Marketing spend increases. Revenue doesn't keep pace. ROI on paid traffic deteriorates.
Competitors with optimized experiences capture your high-intent visitors. Someone searches for your category, lands on your site, doesn't convert, searches again, finds a competitor with a better-optimized experience, converts there. You paid for the awareness. They got the revenue.
Your marketing team knows there's low-hanging fruit they can't capture. They see competitors doing things you're not. They pitch ideas that sit in backlog. Morale suffers. Talented people leave for companies that empower them to optimize.
CFO is questioning marketing spend. Board is asking uncomfortable questions about conversion trends. You're in investor presentations defending flat conversion while competitors show growth. The pressure builds.
You don't need more data. You need diagnostic clarity: exactly where conversion is breaking and exactly how to fix it.
Free conversion audit identifies your top 3-5 conversion leaks. Not generic best practices. Specific issues on your site with your traffic that are costing you revenue right now.
We analyze your funnel across device, traffic source, new vs. returning visitors, and product category. We identify where you're bleeding conversion and quantify the revenue impact of each leak.
Prescriptive roadmap showing exactly what to fix and in what order. Not "test your homepage." Specific: "PDP has no recommendations above the fold—adding them typically lifts conversion 12-18% for your catalog type."
Fix high-impact, low-effort leaks first. We prioritize by ROI and time-to-deploy. The issues that will move your conversion rate fastest with the least implementation friction go to the top of the roadmap.
Deploy proven tactics from your category. We've seen hundreds of retailers in your vertical. We know what works for businesses like yours. No experimentation on fundamentals—just deploy what's already proven to work.
Measurable results within 30-60 days. Not a six-month optimization journey. We focus on wins you can show the board next quarter, not next year.
This isn't a generic audit that tells you to "improve site speed" or "add trust signals." It's specific: "Your mobile PDP converts 40% lower than desktop. The add-to-cart button is below the fold. Moving it recovers 8-12% of mobile conversion based on benchmarks from similar catalogs."
You get a prioritized list of fixes with expected impact ranges, implementation difficulty, and time-to-deploy. You know exactly what to do Monday morning.
We analyze your Google Analytics, traffic sources, device mix, funnel drop-off points, and high-traffic pages. We identify where conversion is breaking and where the biggest opportunities are.
We compare your metrics to category benchmarks. We see how your conversion rate, bounce rate, add-to-cart rate, and checkout completion stack up against similar businesses.
We audit your highest-traffic pages: homepage, category pages, product detail pages, cart, and checkout. We identify missing best practices, friction points, and quick wins.
We look at personalization opportunities: Are you treating all visitors the same? Are you leveraging recommendations? Are you using social proof? Are you showing urgency where appropriate?
You receive a prioritized list of conversion leaks with revenue impact estimates. Not "fix these 50 things." Focused: "These are your top 5 leaks. Fix them in this order. Here's the expected impact of each."
Each recommendation includes implementation guidance, expected lift range, and time-to-deploy estimate. You know exactly what to do and what results to expect.
Detailed conversion audit report identifying top 3-5 leaks in your funnel. Quantified revenue opportunity for each leak. Prioritized roadmap with implementation timeline. Category benchmarking showing where you stand vs. competitors.
 19%
19%
A brand with a known conversion concern was struggling to identify why their conversion rate was stagnant despite growing traffic. Their team knew something was wrong but couldn't pinpoint the specific issues. Generic optimization tactics weren't moving the needle.

How do you identify the specific conversion leaks that are costing you revenue when you have hundreds of potential issues and limited resources to fix them?

Monetate conducted a conversion audit, identifying the top 3 conversion leaks: missing product recommendations on PDPs, no social proof on high-traffic products, and a mobile checkout flow with unnecessary friction.

Customer with conversion concern identified and fixed 3 conversion leaks in first 30 days, 19% lift.
The brand deployed fixes in priority order: recommendations first (biggest impact, easiest to deploy), social proof second, mobile checkout optimization third. Each fix was live within 10 days and showing measurable results.
High-traffic product detail pages with no product recommendations. Visitors view one product, don't see related items, leave. Adding "Complete the Look" or "Customers Also Bought" recommendations typically drives significant add-to-cart lift.
Product pages with no reviews, ratings, or social proof signals. Visitors don't trust unknown brands without validation. Adding star ratings, review counts, and "X people bought this today" messaging reduces purchase hesitation.
Mobile checkout requires 12 form fields and 4 screens. Desktop checkout requires 6 fields and 2 screens. Mobile abandonment is 2x higher. Streamlining mobile checkout to match desktop eliminates unnecessary friction.
First-time visitor from paid search sees the same homepage as a returning customer from email. No personalization by traffic source, device, or visitor type. Tailoring homepage hero and featured products by audience segment improves relevance.
High-demand products with limited inventory show no stock indicators. "Only 3 left" or "12 people viewing this now" creates healthy urgency for genuinely scarce items and drives immediate purchase decisions.
Mobile pages take 6+ seconds to load. Every second of delay costs conversion points. Optimizing mobile performance with lazy loading, image compression, and code optimization recovers lost mobile conversion.
Typically 2-3 weeks from kickoff to delivery. Week 1 is data analysis, Week 2 is site audit, Week 3 is roadmap delivery.
Google Analytics access (read-only), traffic volume by source/device, and product catalog structure. We handle the rest.
Yes. The audit is complimentary. If you choose to work with us to fix the issues we identify, that's a separate conversation. No obligation.
That's exactly why we offer Concierge: we can implement the fixes for you. You approve the roadmap, we deploy it. You see results without taxing your engineering team.
We provide ranges based on category benchmarks and similar implementations. Actual results vary by traffic mix and implementation quality, but the estimates are conservative and grounded in real data.